So you’ve got a page loading performance problem. Maybe you’re not lazy-loading images. Or maybe your marketing department wants to add some 3rd-party script that you’re worried will suck the lifeblood from your page. Or maybe you’ve tried loading a page on a mobile network and noticed that it’s just too damned slow. In any case, you have an idea for how to fix it.
How can you test optimization ideas and determine what the impact on page speed performance will be – without deploying any changes?
Chrome’s Local Overrides let you save copies of page resources (HTML, CSS, JS…), modify them and reload a page with those modifications. The feature has been around since Chrome 65. I’ve found it especially useful for testing out performance optimization ideas when:
- I have no access to a site’s source code
- Different teams are responsible for different parts of a page
- There is no Real User Monitoring of performance metrics
- I want to test ideas before discussing them with others
Here’s how I use Local Overrides.
1. Set Up Local Overrides
Using Chrome, you can open up a new guest window, an Incognito window or a profile that you use just for testing. But I prefer to start an instance of Chrome for remote debugging. That way any extensions or settings I have don’t affect testing. I plug this into the Terminal on Mac:
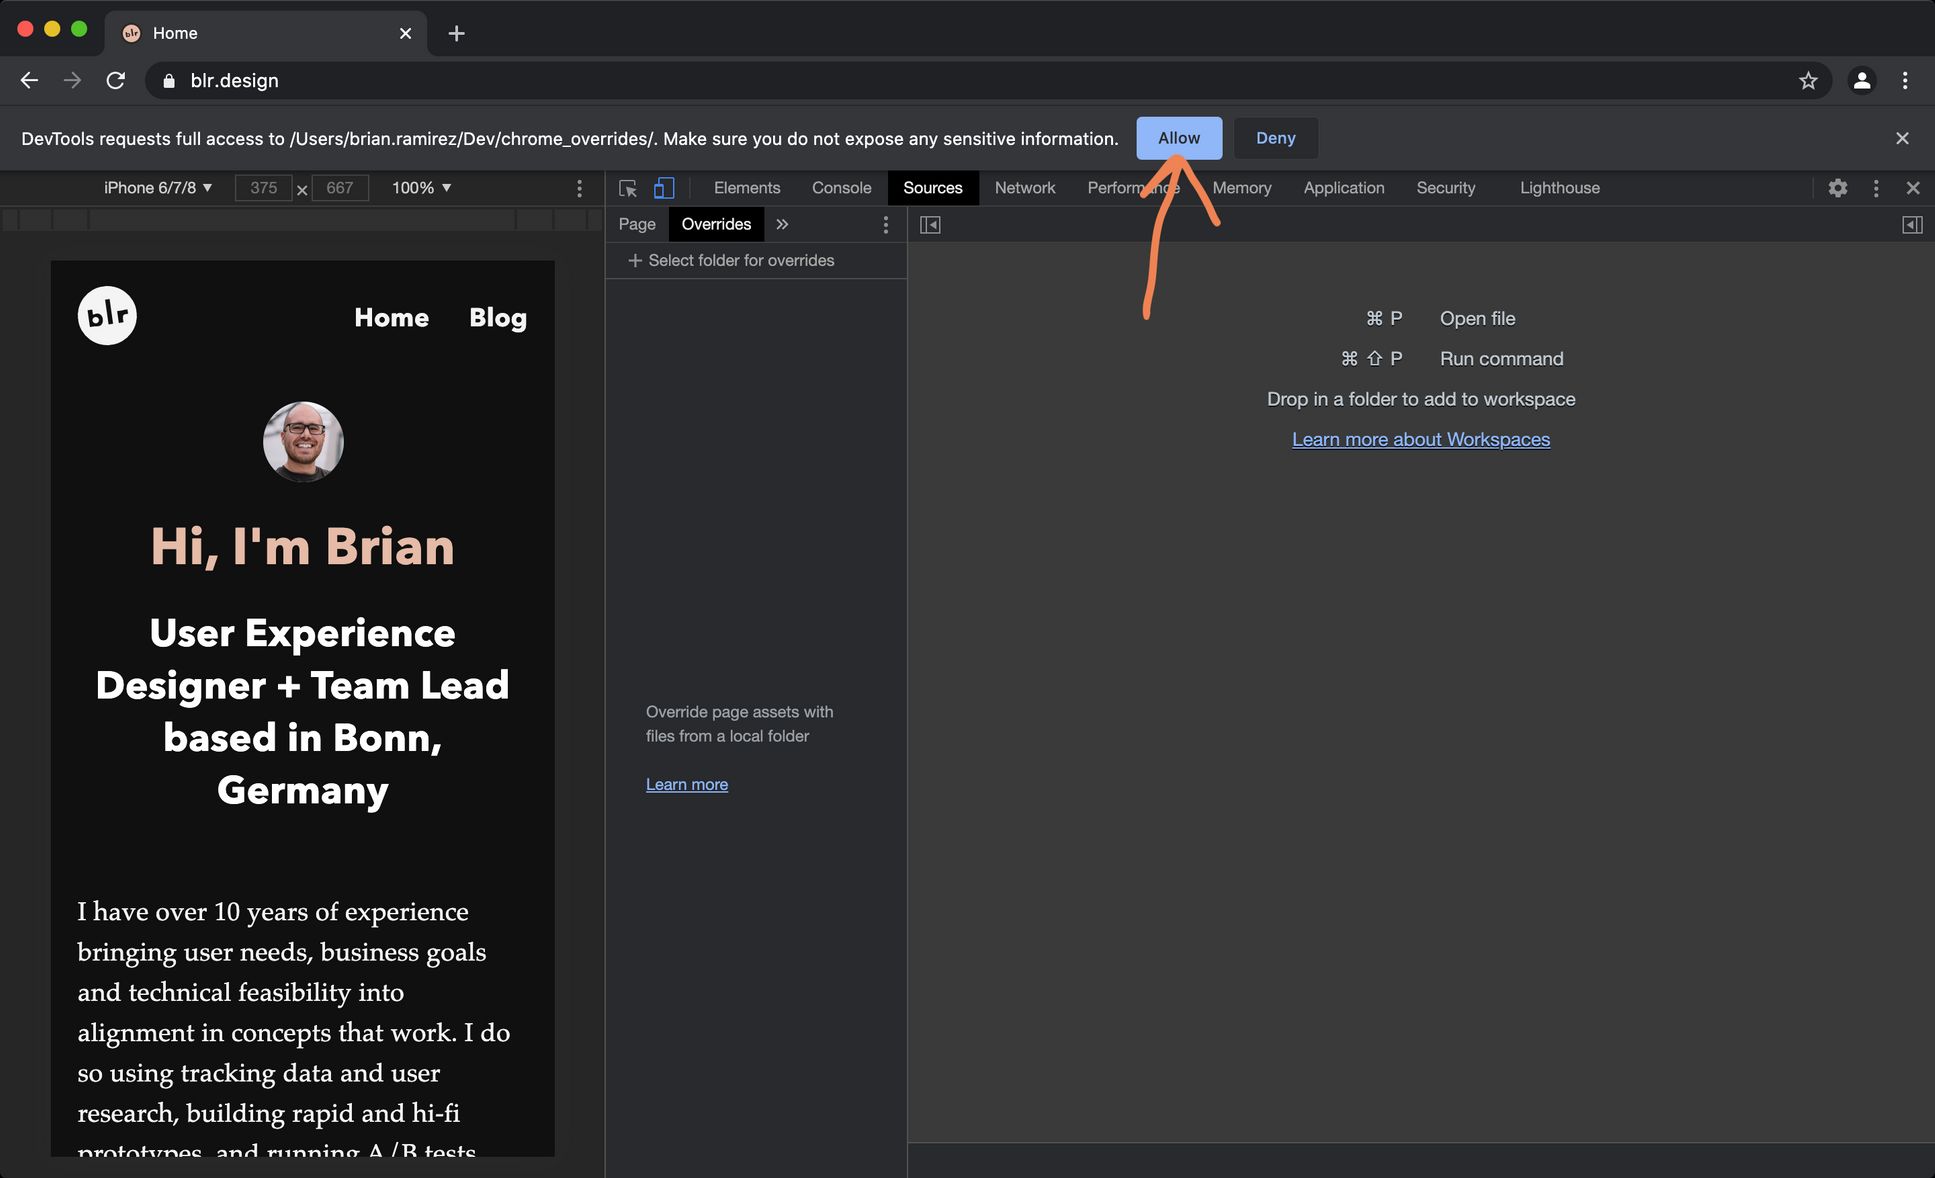
/Applications/Google\ Chrome.app/Contents/MacOS/Google\ Chrome --remote-debugging-port=9222 --no-first-run --no-default-browser-check --user-data-dir=$(mktemp -d -t 'chrome-remote_data_dir')Next, visit the page that you want to test and open up the Sources tab in DevTools. Select “Local Overrides” from the More menu (“>>”) and click “Select folder for overrides”. You can either create a new folder or reuse an existing folder. Then allow Chrome to use the folder to store copies of files.

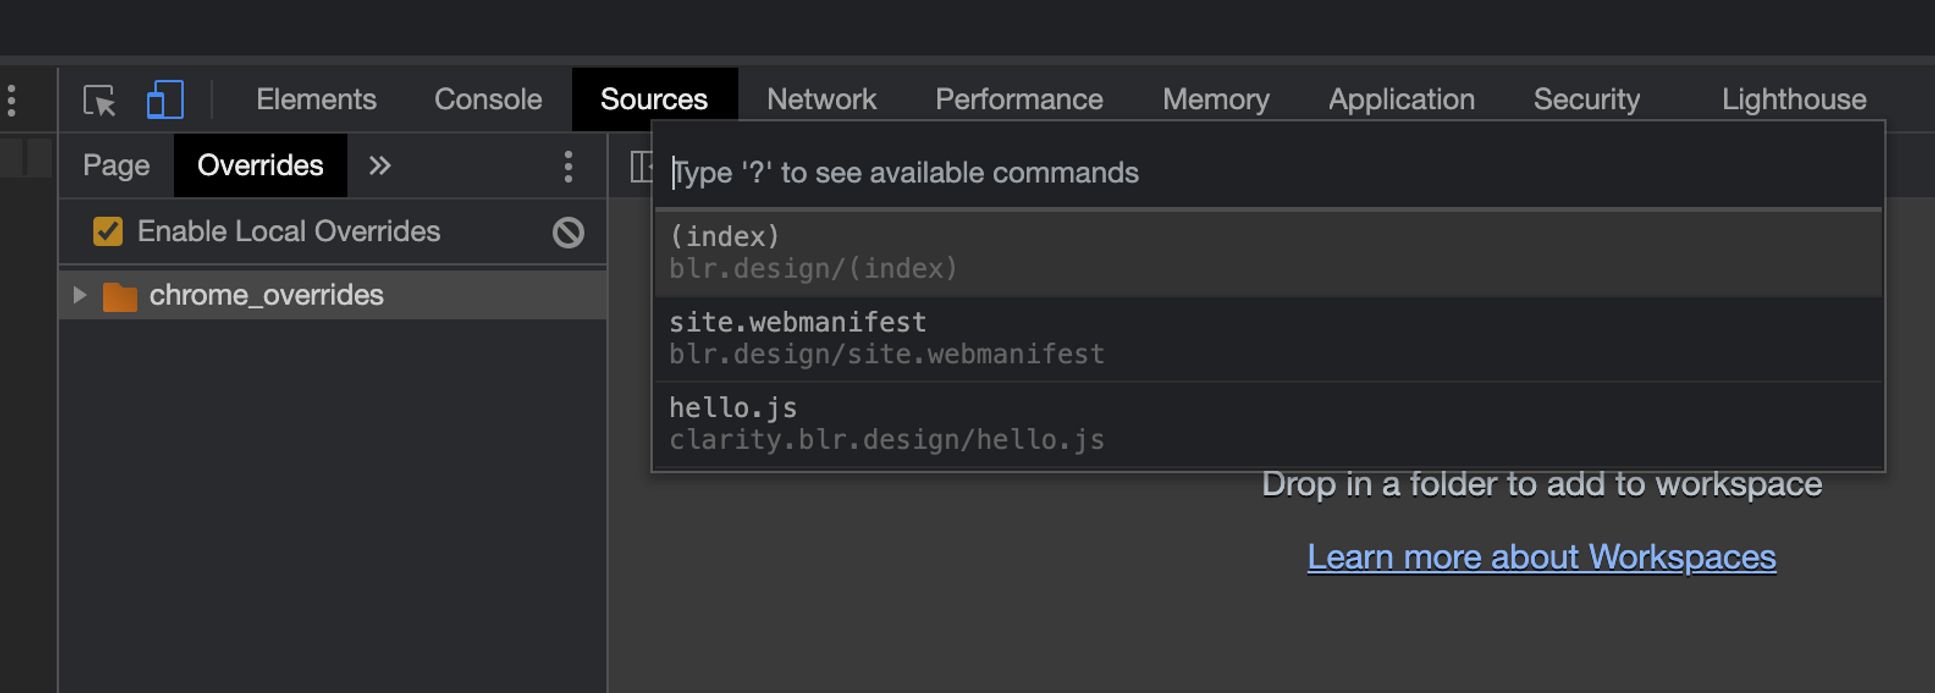
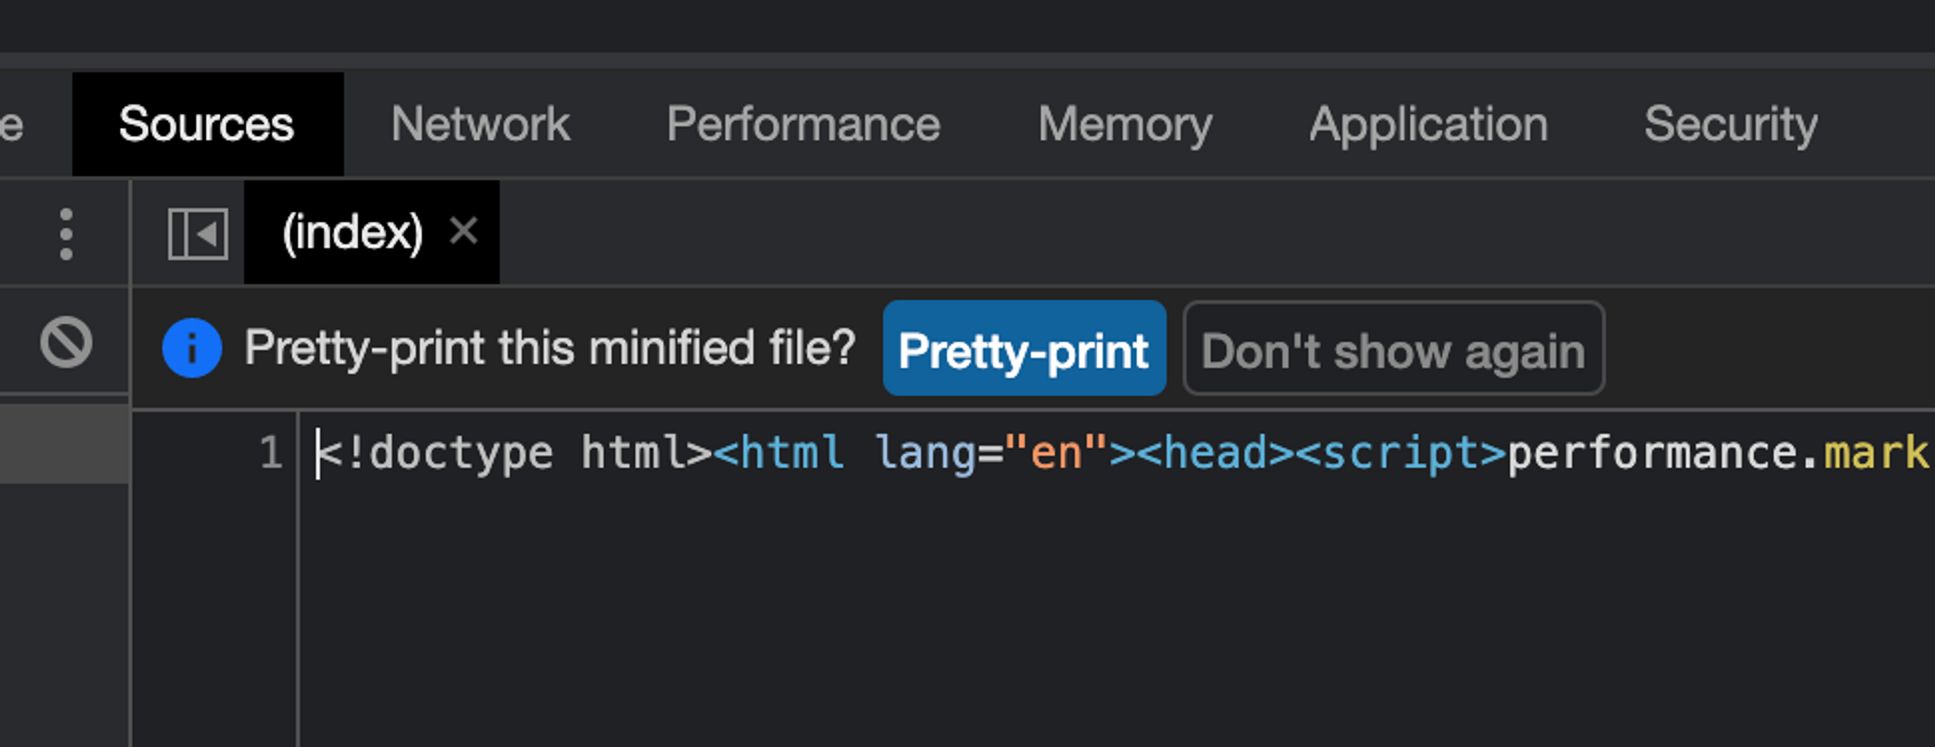
Open the main HTML document by pressing ⌘ p and searching for it. I usually click the “Pretty-Print” button and copy and paste the formatted code back in the original file so it’s easier to work with.
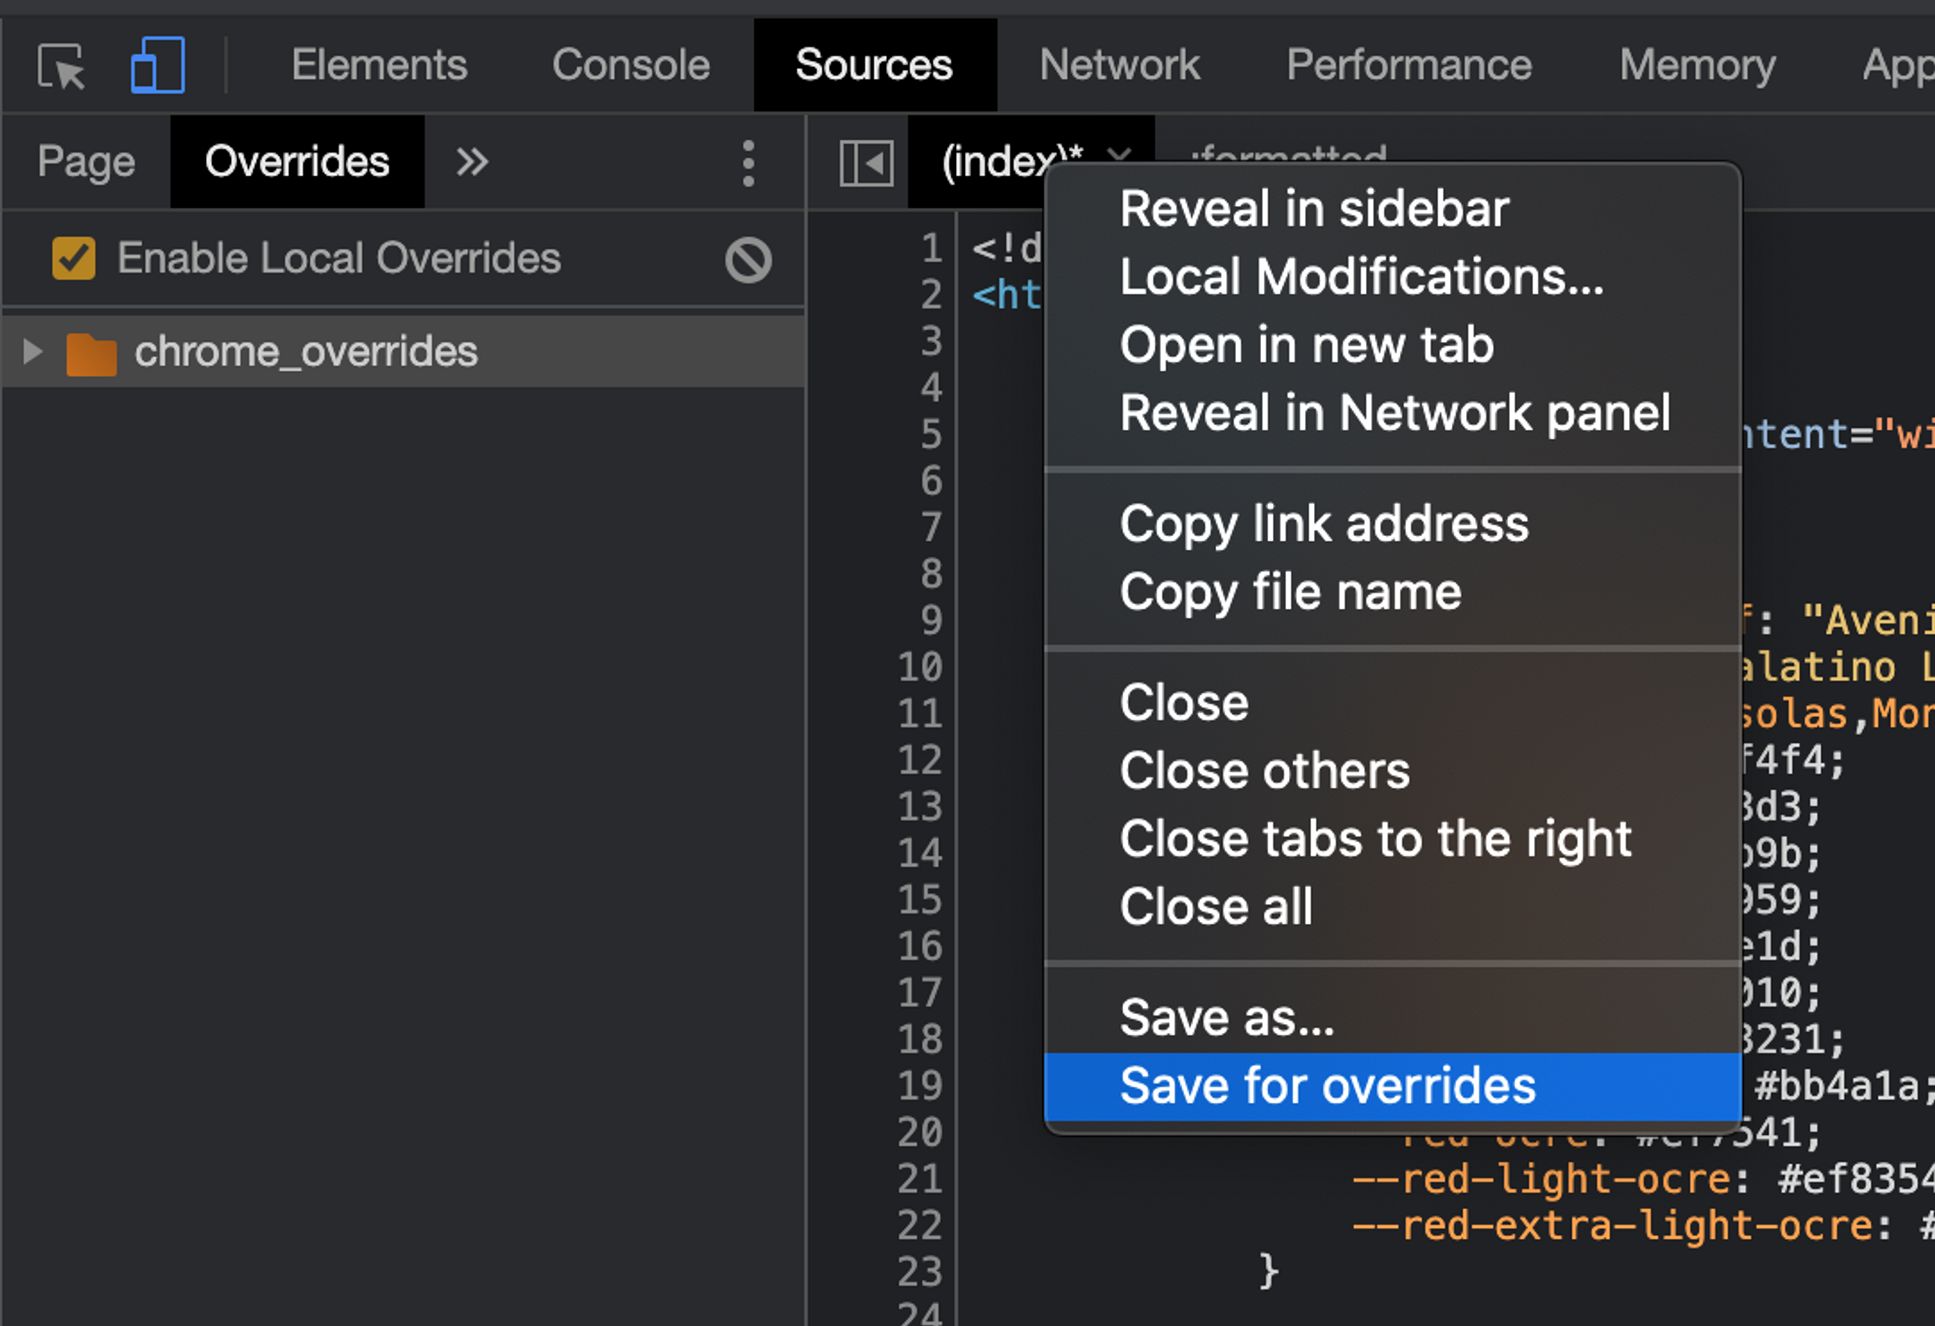
Now right-click the tab of the document and select “Save for overrides”; or simply save the open file by pressing ⌘s.
Now you can make what ever changes you want, save them and reload the page to see them.
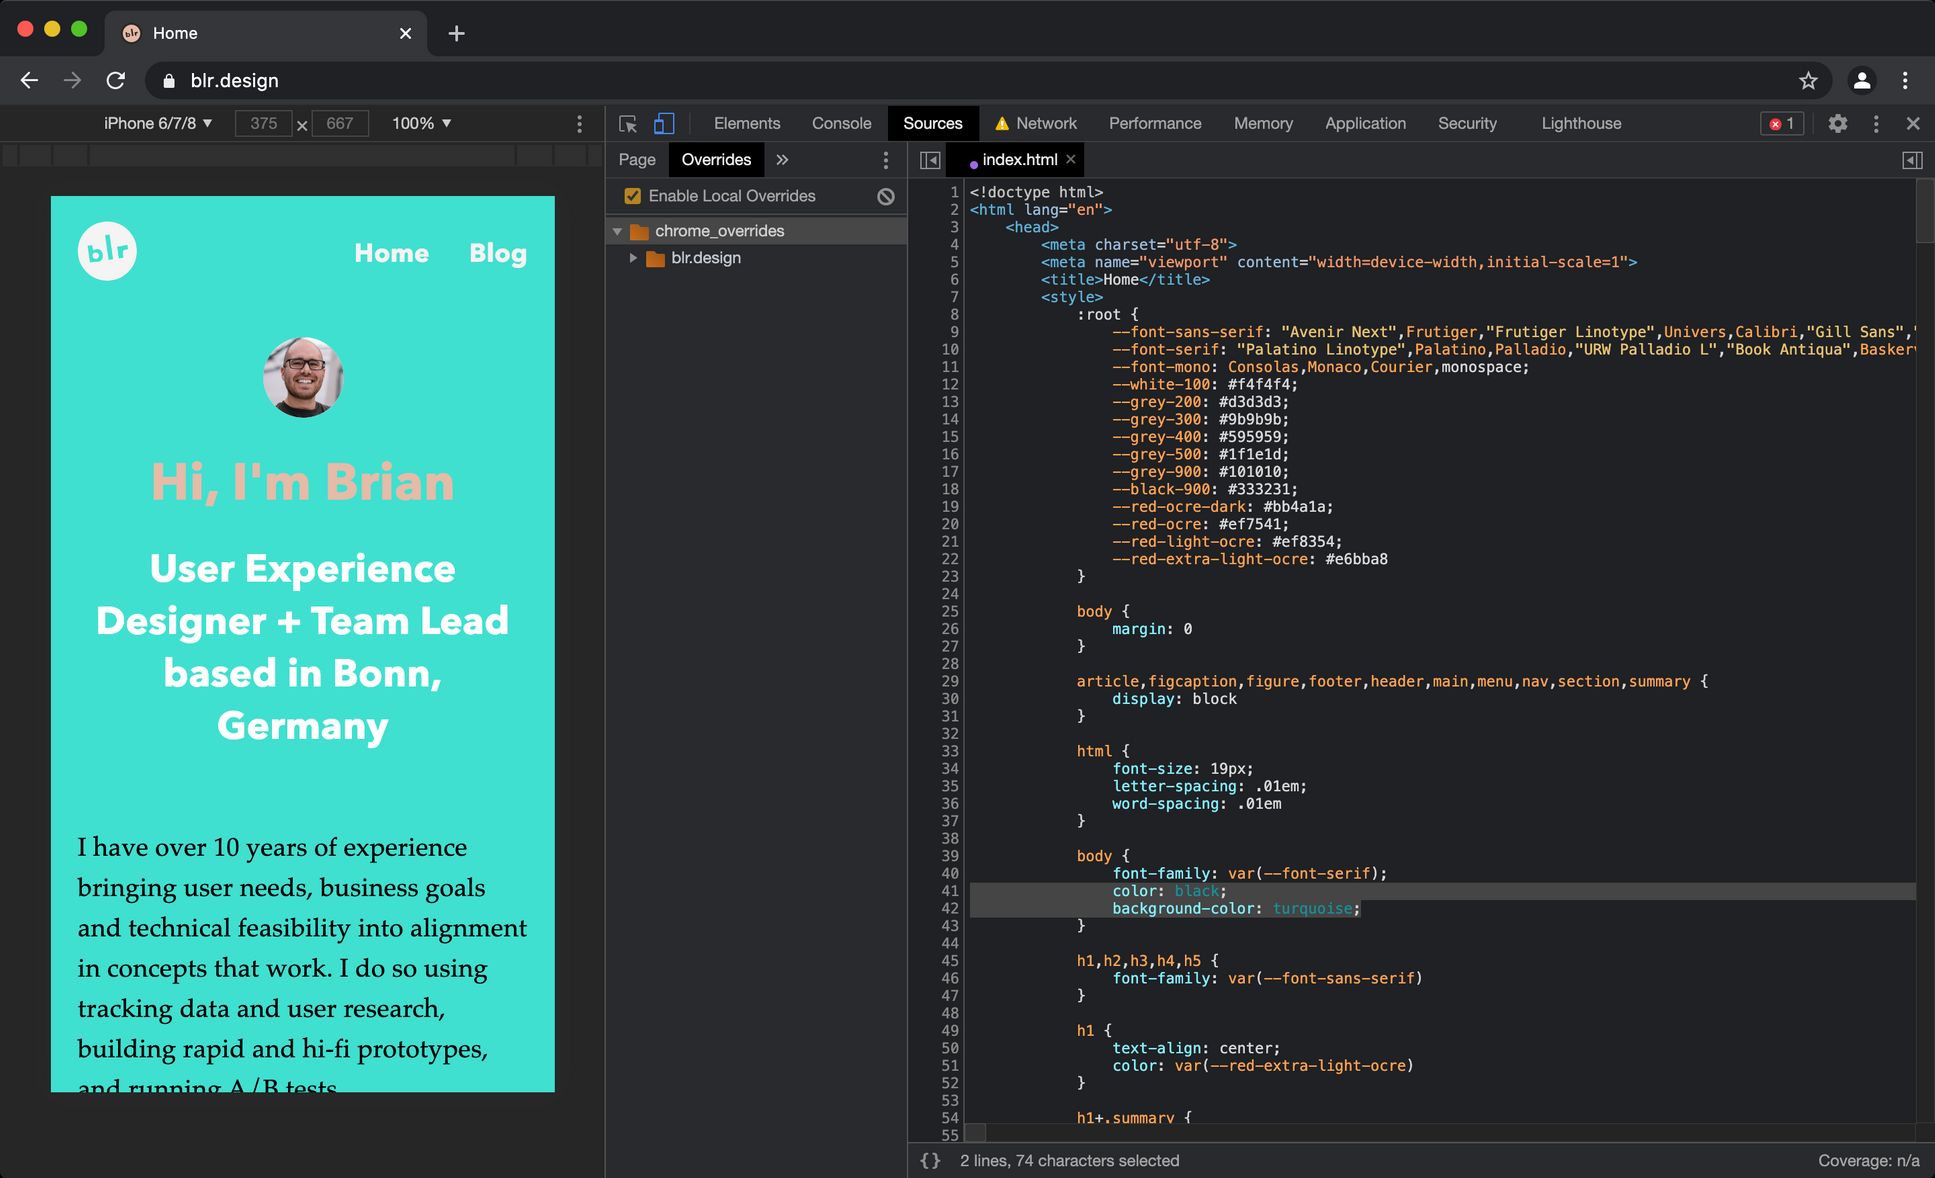
The little purple dot (“🟣”) before the filename in the tab of the Sources panel means that it’s being used as a Local Override. An asterisk (“*”) after the filename means there are unsaved changes.
I usually edit the document in my IDE of choice and initialize a Git repo on it and commit it as is.
2. Set Performance Marks
In order to find out how fast the page loads, you need to set points of reference.
With performance marks, you can create timestamps for important points in time during page loading, e.g.
- when the
<head>starts or finishes parsing - when the
<body>starts or finishes parsing - when a hero image loads
- when an important element (e.g. a product name or price) becomes visible
Performance measures give you the time duration between two performance marks that you specify.
I usually set performance marks for the <head>, <body> and <footer> as I learned from the amazing Harry Roberts:
<head>
  <!-- Mark the start of the head -->
  <script>
    performance.mark("HEAD Start");
  </script>
  ...
  <!-- Mark the end of the head -->
  <script>
    performance.mark("HEAD End");
    performance.measure("HEAD Time", "HEAD Start", "HEAD End");
  </script>
</head>
3. Log Metrics to Console
Performance marks, measures and Web Vitals will show up in Chrome DevTools’ Performance tab. And that will of course help with identifying performance issues. But I’ve found that logging them to console makes it easier to copy-paste the values and compare them between test variants.
Also, network response times can vary from page load to page load, so it’s important to do several “test runs” (i.e. page loads) and get the median metric values. But doing multiple page reloads and copy-pasting the results each time by hand is tedious.
I wrote the following script to help me. It reloads the page several times and writes performance marks and Web Vitals to localStorage each time, then calculates the medians and logs those to console as a nifty table.
Just add my “test runner/logger” script to the main document just before the closing </body> tag.
<script type="module">
  // See https://github.com/GoogleChrome/web-vitals for more info on using Web Vitals
  import { getTTFB, getFCP, getCLS, getLCP } from "https://unpkg.com/web-vitals?module";

  let storedPerfMarks = JSON.parse(localStorage.getItem("perfMarks"));
  let perfMarks = performance.getEntriesByType("mark");
  let perfMarksLength = perfMarks.length;
  let storedVitals = JSON.parse(localStorage.getItem("storedVitals"));
  let ALL_PERF_METRICS = [];

  function createEntry(key, val) {
    var entry = {
      metric: key,
      value: val,
    };
    return entry;
  }

  function writeValue({ name, value }) {
    if (storedVitals == null) storedVitals = [];
    var entry = {
      metric: name,
      value: value,
    };
    storedVitals.push(entry);
    localStorage.setItem("storedVitals", JSON.stringify(storedVitals));
  }

  function median(array) {
    if (array.length === 0) return `Error: Unable to calculate median.`;
    array.sort(function (a, b) {
      return a - b;
    });
    var mid = array.length / 2;
    return mid % 1 ? array[mid - 0.5] : (array[mid - 1] + array[mid]) / 2;
  }

  function storeMetrics() {
    if (storedPerfMarks == null) storedPerfMarks = [];
    let tempEntry = [];
    for (var i = 0; i < perfMarksLength; i++) {
      tempEntry.push(createEntry(perfMarks[i].name, perfMarks[i].startTime));
    }
    storedPerfMarks.push(tempEntry);
    localStorage.setItem("perfMarks", JSON.stringify(storedPerfMarks));
  }

  function storeVitals() {
    getTTFB(writeValue);
    getFCP(writeValue);
    getCLS(writeValue);
    getLCP(writeValue);
  }

  // Reduce the 'storedVitals' object
  function groupBy(objectArray, property) {
    return objectArray.reduce(function (acc, obj) {
      let key = obj[property];
      if (!acc[key]) {
        acc[key] = [];
      }
      acc[key].push(obj);
      return acc;
    }, {});
  }

  // Reload the page
  function reload(time) {
    setTimeout(function (time) {
      location.reload(true);
    }, time);
  }

  function calculateMedianPerfMarks() {
    // Create arrays of specific perf marks and get their medians
    for (var i = 0; i < perfMarksLength; i++) {
      let tempArr = [];
      let metric;
      Object.keys(storedPerfMarks).forEach((obj) => {
        metric = storedPerfMarks[obj][i].metric;
        tempArr.push(storedPerfMarks[obj][i].value);
      });
      let medianValue = median(tempArr);
      ALL_PERF_METRICS.push({ metric, medianValue });
    }
  }

  function calculateMedianVitals() {
    let groupedstoredVitals = groupBy(storedVitals, "metric");
    Object.values(groupedstoredVitals).forEach((obj) => {
      let tempArr = [];
      let metric;
      obj.forEach((i) => {
        metric = i.metric;
        tempArr.push(i.value);
      });
      let medianValue = median(tempArr);
      ALL_PERF_METRICS.push({ metric, medianValue });
    });
  }

  // Test runner
  function runLocalPerfTests(r = 5) {
    let runCount = r;

    // Capture metrics for each test run
    if (!localStorage.getItem("runs") || localStorage.getItem("runs") > 0) {
      if (!localStorage.getItem("runs")) {
        localStorage.setItem("runs", runCount);
        console.log("Performance testing starting...");
      }
      let x = localStorage.getItem("runs");
      console.log(`Test Run ${runCount - x + 1} of ${runCount}`);
      x--;
      localStorage.setItem("runs", x);

      storeMetrics();
      storeVitals();
      reload(2000);

      // Calculate medians and log metrics
    } else if (localStorage.getItem("runs") == 0) {
      console.log("Calculating medians of performance metrics...");
      calculateMedianPerfMarks();
      calculateMedianVitals();

      console.log(`============ Performance Metrics ============`);
      console.log(`============(medians of ${runCount} tests)============`);
      console.table(ALL_PERF_METRICS);
      localStorage.clear(); // Clear local storage to clean up
      console.log(`Performance testing complete.`);
    }
  }

  // Run the performance tests after the page load event
  window.addEventListener("load", (event) => {
    runLocalPerfTests(); // With 5 runs as default. Otherwise add an argument, e.g. 7.
  });
</script>Please note: The script won’t work in Internet Explorer. And since it runs upon the load event, anything happening after that will not register.
With perf marks set and my test runner/logger in place, I save the document and commit the changes as “baseline” in my repo.
4. Measure the Baseline
Throttle the connection in DevTools’ Network tab to “3Gfast”, which is the same setting used in Google Lighthouse and WebPageTest for smartphone testing.
Also make sure you have caching disabled if you want to load external resources from cache.
Now, reload the page. The test runner script will reload the page several times after the load event, and then performance marks and Web Vitals should appear in the console.
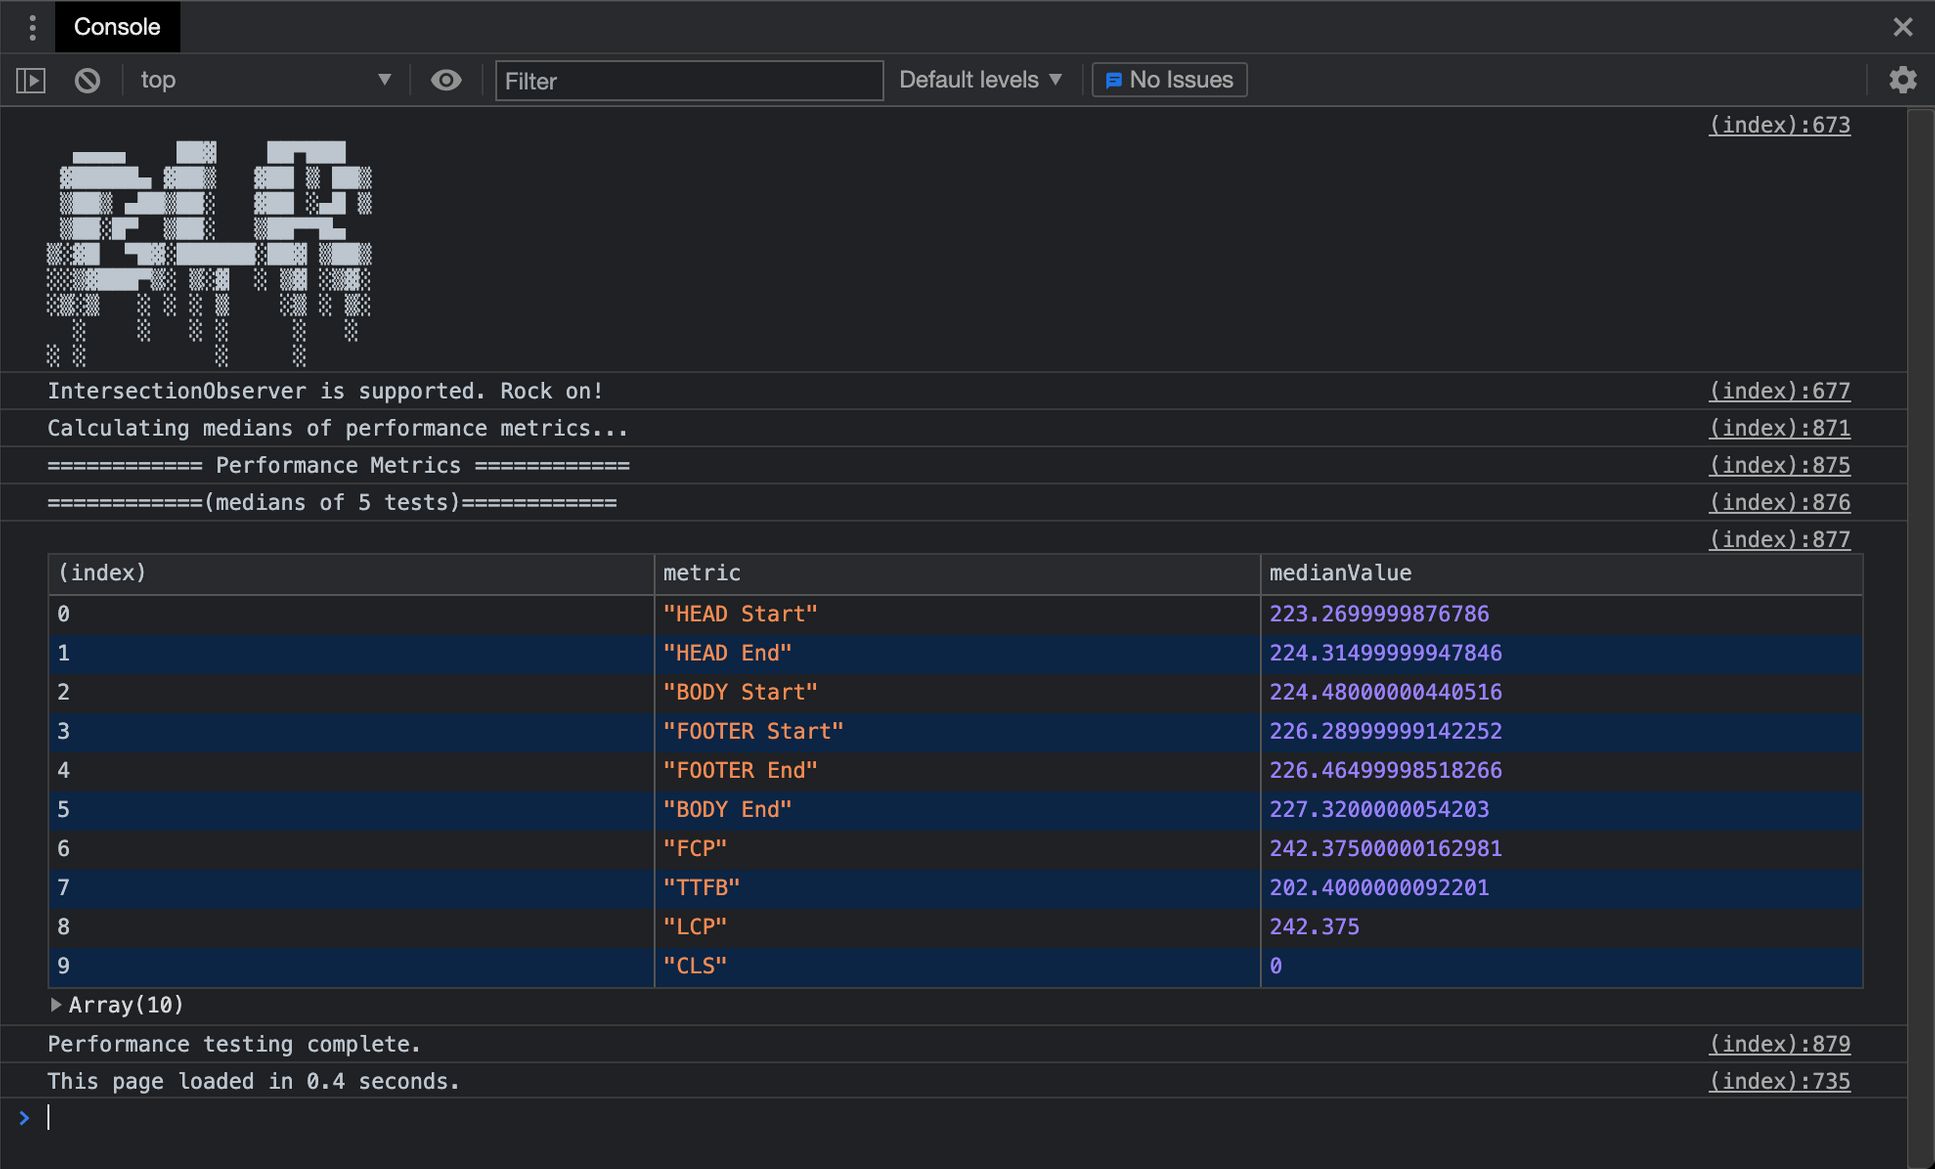
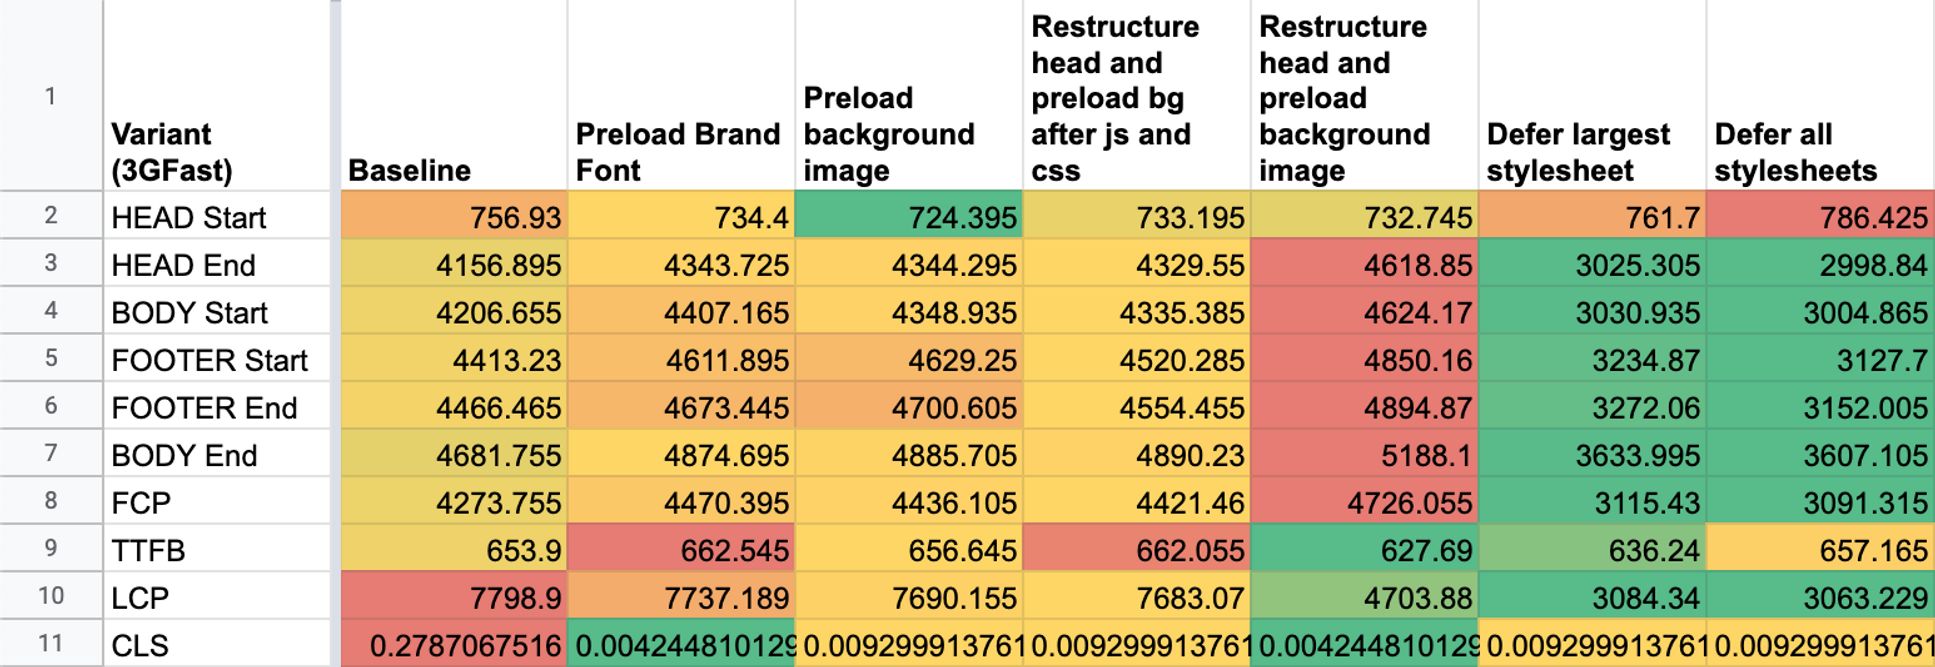
Next, copy the values from the table in the console and paste the values only (⇧ ⌘ p) into a spreadsheet and use conditional highlighting to make it easier to see changes between metric values.

5. Measure Changes, Rinse & Repeat
Now you can make changes to the page resources, save the overrides, reload the page, then copy the performance metrics to the spreadsheet to compare them to the baseline.
Sometimes it’s fun to go wild and just comment out tons of stylesheet links and scripts to see what happens. In that case, I usually comment out the test runner/logger script and reload the page to see if anything is out of the ordinary.
A few last words
Working with Local Overrides means you’re loading any saved resources from your machine. IRL you have to deal with latencies, will affect timings. So with Local Overrides, you cannot find out how fast or slow performance metrics will be in the wild.
Rather, with Local Overrides, you can highlight the potential of making certain changes – all from the comfort of your machine. That alone is worth it’s weight in gold.